

What Is Real User Monitoring (RUM)?
Real User Monitoring is a passive technique that collects performance and experience data from the browsers of real people using your site (real devices, networks, and locations) instead of from a scripted lab test. Here is what it measures, how it works, and where it stops.
Definition
Real User Monitoring (RUM) is a passive monitoring technique that collects performance and experience data from real users' browsers as they actually use your site (on real devices, networks, and locations) rather than from a scripted lab test. It reflects the real-world variability that synthetic tests miss.
The key word is passive. RUM does not drive your site; it rides along with the people already using it. A small piece of JavaScript loads with your pages, watches what the browser is already doing, and reports back. Because the data comes from actual sessions, it is often called field data (measured in the field, on whatever hardware and network your users happen to have), as opposed to lab data, which is measured in a controlled, repeatable environment. Both are useful, but they answer different questions, and confusing them is the most common mistake teams make with performance.
That distinction is the whole point of RUM. Your staging environment runs on a fast machine on a fast network sitting next to the server. Your users do not. Some of them are on a three-year-old phone, on a congested mobile network, three time zones away from your nearest edge. RUM is how you see them: the long tail of slow devices and flaky connections you would never think to script a test for. It is the difference between measuring the site you built and measuring the site people actually load.
RUM vs synthetic monitoring
RUM's natural counterpart is synthetic monitoring: scripted tests run from controlled environments on a schedule. A synthetic test always does the same thing (the same steps, the same machine, the same network), which makes it wonderfully consistent. That consistency is exactly why synthetic is the right tool for alerting and uptime: when the conditions never change, any movement in the number is a real signal you can page someone about, and you can catch a regression before it ever reaches a user.
But consistency is also synthetic monitoring's blind spot. It only ever sees the conditions you scripted. If you test from a datacenter in one region on a fast connection, that is the only reality it knows, and it will happily report that everything is fast while a large slice of your users struggle. RUM inverts this trade: it is noisy and variable precisely because real users are noisy and variable, and that variability is the signal. The two are not competitors; mature teams run both. Synthetic guards the happy path and catches breakage early; RUM tells you the truth about what production feels like.
| Feature | Property | RUM (field data) | Synthetic (lab data) |
|---|---|---|---|
| Data source | No | Real users' browsers | Scripted bots |
| Measures real-world device/network variability | No | ✓ | No |
| Consistent, repeatable conditions for alerting | No | No | ✓ |
| Can run before release / on the happy path | No | No | ✓ |
| Surfaces the long tail of slow devices and networks | No | ✓ | No |
What RUM measures
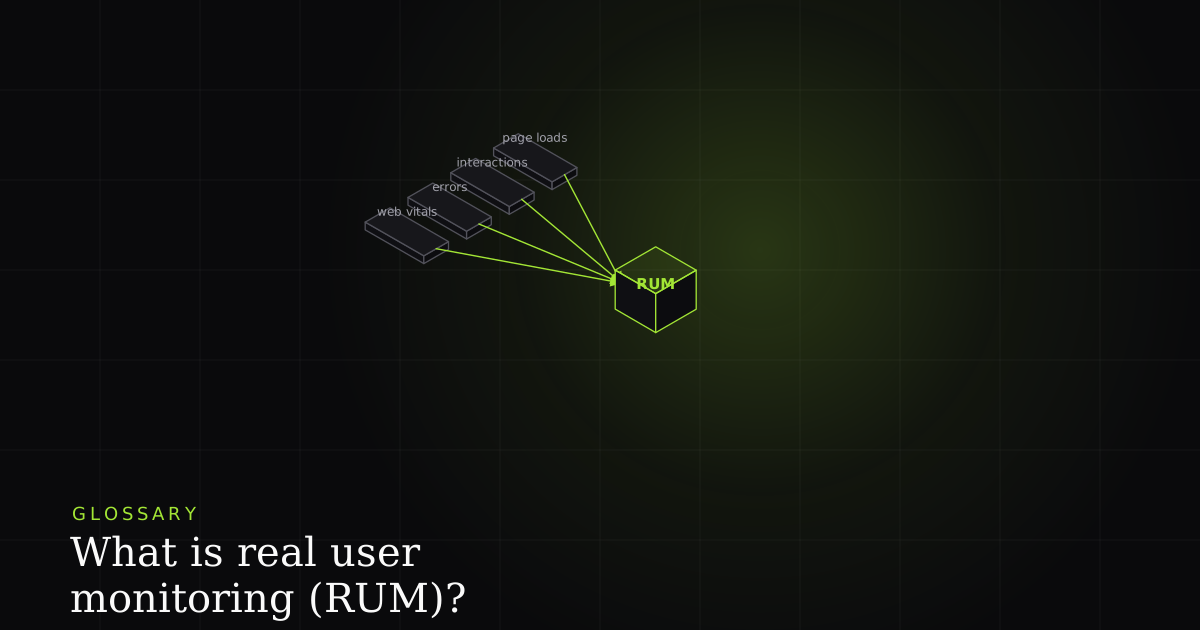
A typical RUM setup captures a handful of signal families. Page-load and navigation timing: how long the page took to load and become interactive. Core Web Vitals: LCP, INP, and CLS, the user-centric metrics Google uses to describe loading, interactivity, and visual stability. JavaScript errors thrown in the browser. Resource timing for individual assets (which script or image was the slow one). Interactions, so you can see how responsive the page felt when tapped or clicked. And crucially, dimensional breakdowns by geography, device, browser, and connection type.
Those breakdowns are what make RUM actionable rather than just interesting. An aggregate median can look perfectly healthy while one segment quietly suffers: mobile users in a single country, or one browser version, or everyone on a slow connection. Averages hide this; percentiles and segments reveal it. The practical discipline of RUM is to stop asking 'is the site fast?' and start asking 'fast for whom?' The user-centric metrics exist precisely so you can answer that at the level of a real person's experience.
How RUM works
Under the hood, RUM is less magic than it looks. A small JavaScript snippet loads with your page and taps the browser's built-in Performance APIs: PerformanceObserver to subscribe to timing entries as they happen, plus the Navigation Timing and Resource Timing interfaces for load and asset data. The browser is already recording these numbers for its own purposes; RUM just reads them. When the metrics are ready (often as the page unloads or the tab is hidden), the snippet packages them into a compact payload and fires it off as a beacon, a small, fire-and-forget HTTP request designed not to block or delay the user. Millions of those beacons aggregate into the dashboards and percentiles you actually look at.
Because the data is real, it also feeds decisions outside your own walls. Google's Chrome User Experience Report (CrUX) is essentially RUM at web scale, and the Core Web Vitals drawn from it are a ranking signal in Search. In other words, optimizing for field data is not just an internal nicety. It is how you optimize for the experience Google measures on your behalf. Lab numbers can pass while field numbers fail, and it is the field numbers that count.
RUM vs APM, session replay, and observability
RUM sits in a crowded neighborhood of monitoring terms, so it helps to place it. APM (application performance monitoring) watches the backend: server latency, database queries, traces across services. RUM watches the front end, in the user's browser. Session replay reconstructs a single session so you can watch what one user saw. Observability (what is observability) is the broader discipline of being able to ask arbitrary questions about your system from its outputs: logs, metrics, traces. RUM is best understood as one specific stream feeding that picture: aggregate, front-end, field metrics.
The bridge to the individual
Here is the gap RUM leaves, and it is by design. RUM tells you a cohort is slow or erroring. It hands you a percentile, a segment, a trend line. What it cannot hand you is the one broken session behind a specific bug report: the actual user whose checkout hung, with the actual console error and the actual network response that caused it. To fix a specific case, you have to descend from the aggregate to the individual, and that is a different kind of artifact entirely: a session replay of what one person experienced, not a statistic across thousands.
This is exactly the complementary pairing worth internalizing. Use RUM to find where to look: which pages, which segments, which devices are hurting. Then use a captured individual session to understand why for the specific case in front of you. If you are shopping for the second half of that pairing, our roundup of the best session replay tools of 2026 is a good starting point. The two levels are not redundant; they are the aggregate and the instance, and debugging needs both.
This is where BugMojo fits. RUM answers 'which pages and segments hurt', the statistical view across your traffic. BugMojo answers the other half: when a real bug gets reported, the browser extension captures that specific session with its rrweb replay, console output, and network requests bundled together, so you get the why for the individual case. RUM tells you the mobile-checkout cohort has a bad INP; a captured BugMojo session shows you the one user whose tap hung on a slow POST /api/checkout and the console error it threw. Aggregate signal points you at the room; the captured session shows you what is on fire inside it.
RUM surfaces which pages and cohorts hurt. When one of those users files a bug, BugMojo captures the exact session (rrweb replay, console, and network) so you (and your AI agent over MCP) see why, not just that.
Install the extensionFrequently asked questions
Frequently asked questions
Sources
- Real user monitoring: passive monitoring of real user interactions and performance, Wikipedia (2026)
- Performance API: browser interfaces for navigation, resource, and paint timing, MDN Web Docs (2026)
- Web Vitals: Core Web Vitals and the role of field (real-user) data, web.dev (Google) (2026)
- User-centric performance metrics: how to measure what real users experience, web.dev (Google) (2026)
Get bug-tracking insights, weekly.
Engineering deep-dives, QA playbooks, and honest tool comparisons. No spam. Unsubscribe in one click.