What Is Observability? (Logs, Metrics, and Traces)
Observability is the ability to understand a system's internal state from the telemetry it emits, so you can answer questions you did not predict in advance. Here are the three pillars (logs, metrics, and traces), how they complement each other, and where session replay fits.
Definition
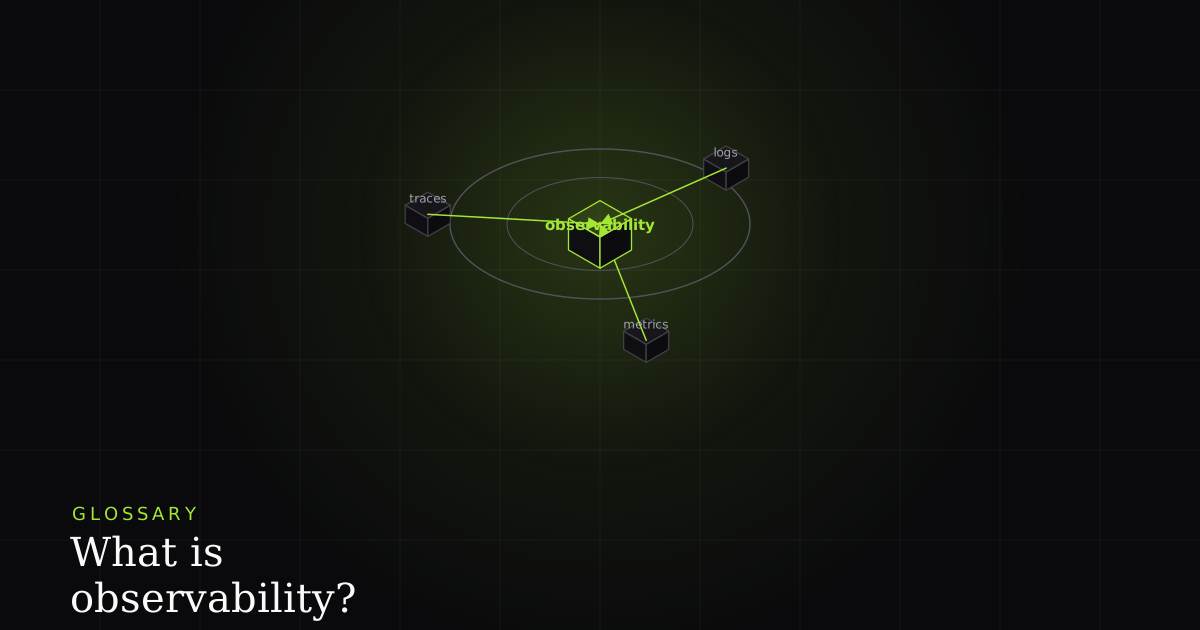
Observability is the ability to understand a system's internal state purely from the telemetry it emits: its logs, metrics, and traces. The working test: can you answer new questions about your system, including failures you never predicted, without shipping new instrumentation? If yes, the system is observable.
The term is borrowed from control theory, where a system is 'observable' if its internal state can be inferred from its external outputs. Applied to software, the OpenTelemetry observability primer frames it as understanding the internal state of a system by examining its outputs, the telemetry it emits at runtime. The load-bearing word is infer: you are not watching the machine directly, you are reconstructing what it did from the signals it left behind.
That reconstruction is the whole point, and it is why observability is more than a fancier word for monitoring. A monitoring dashboard answers questions you thought to ask when you built it. An observable system answers the question you did not think to ask (the novel failure, the one weird customer, the interaction between two services nobody predicted) because the telemetry is rich enough to interrogate after the fact. You do not have to have anticipated the failure to explain it.
The three pillars: logs, metrics, and traces
Observability is conventionally built from three kinds of telemetry, the three pillars. They are not interchangeable; each answers a different class of question, and each carries a different cost.
Logs are structured, timestamped records of discrete events. A log line is the detailed account of what exactly happened to this request: the parameters it carried, the branch it took, the error it threw. Modern practice favours structured logs (key-value or JSON rather than free text) so they can be queried instead of grepped. Logs are the richest of the three signals and the most flexible, but that richness is also their cost: at high cardinality and high volume they become expensive to store and slow to search, so you rarely log everything about everything.
Metrics are pre-aggregated numeric time-series: counters that only go up (requests served), gauges that rise and fall (memory in use), and histograms that bucket a distribution (request latency). Because a metric is just a number sampled over time, it is extraordinarily cheap to store and fast to query, which makes metrics the natural substrate for dashboards and alerting. The trade-off is baked into the word aggregated: a metric tells you the p99 latency doubled, but it has thrown away the individual requests, so it can never tell you which request or why. Metrics are great at detecting that something changed and useless at explaining it.
Traces follow a single request as it flows through a distributed system. A trace is a tree of causally linked spans (each span a timed unit of work in one service) stitched together by a shared trace ID as the request hops from the gateway to the auth service to the database and back. A trace shows you the shape of one request's journey: where the time went, which hop failed, and how the services depended on each other. Where metrics are aggregate and logs are per-event, traces are per-request-across-services, which is the view you cannot reconstruct from either of the other two.
How the pillars complement each other
The pillars are most useful read as a sequence, because a real incident walks through all three. Metrics alert you that there is a problem: an alert fires because the error-rate gauge crossed a threshold or the latency histogram's tail blew out. That is all a metric can do: it is a cheap smoke detector, precise about that something is wrong and silent about what.
Traces show you where it happened. With an alert in hand you open a trace for a slow or failing request and see that of 900ms of total latency, 840ms was spent in a single downstream call to the payments service. The trace has localised the problem from 'the system is slow' to 'this one hop is slow' without you reading a line of code. Logs then explain what happened. You pull the logs for that span and find the payments service was retrying a timed-out connection three times before failing over. Metric to trace to log: that something is wrong, where it is wrong, what went wrong. No single pillar gets you the whole story; the value is in the handoff between them.
Observability vs monitoring
The two words are often used interchangeably, but the distinction is real and worth holding onto. Monitoring watches known-unknowns: you decide in advance which signals matter (CPU, memory, error rate, queue depth) and build dashboards and alerts around them. Monitoring answers a fixed question, 'are the things I expected to break broken?', and it answers it well. The Google SRE Book's chapter on monitoring distributed systems treats this as the foundation of running reliable services.
Observability is the wider property that lets you ask new questions about unknown-unknowns: failures you never predicted and therefore never built a dashboard for. In a complex distributed system, most serious outages are novel: an emergent interaction between services that no one designed a check for. If the only way to investigate is to ship new instrumentation and wait for it to recur, the system is not observable. If you can slice and explore the telemetry you already emit and arrive at the answer, it is. Monitoring is best thought of as a subset of what an observable system enables. You still build dashboards for the known-unknowns, but observability is what saves you when the failure is one you did not see coming.
OpenTelemetry: the vendor-neutral standard
Historically the three pillars were three separate worlds: one set of libraries for metrics, another for traces, a third for logs, and each vendor shipped its own proprietary agent, so instrumenting your app quietly locked you into one backend. OpenTelemetry (OTel) exists to end that fragmentation. It is a vendor-neutral open standard (a Cloud Native Computing Foundation project) that provides one consistent set of APIs, SDKs, and wire formats for generating and collecting all three signals.
The payoff is instrument once, send anywhere: you add OpenTelemetry to your services, and the telemetry it produces can be exported to any compatible backend without re-instrumenting when you switch tools. That portability is why OTel has become the de facto standard for application telemetry and why 'is it OpenTelemetry-native?' is now a reasonable first question to ask of any observability vendor.
Where front-end observability fits
The three pillars grew up in the backend, but the same idea applies in the browser, where it usually goes by a slightly different vocabulary. Real-user monitoring (RUM) is front-end telemetry gathered from actual visitors rather than synthetic tests. Its headline metrics are the Core Web Vitals: the aggregate, cheap, alerting-friendly numbers (loading, interactivity, visual stability) that are the browser's answer to backend metrics. They tell you the ninetieth-percentile experience got worse; like any metric, they do not tell you which user or why.
The missing per-event detail on the front end comes from session replay. A replay is single-session front-end observability: a faithful reconstruction of exactly what one user saw and did, paired with the console output and network requests from that session. If Core Web Vitals are the front-end 'metrics' pillar, a session replay plus its console and network is the front-end 'logs and traces' pillar: the definitive record of what happened in one browser, not an average across thousands.
How this shows up in a real BugMojo bug report
Aggregate observability is superb at the population and blind at the individual. Your metrics can show that 0.4% of checkouts fail, your traces can show the failing hop, and none of them can tell you what this one reported user actually experienced. The state that produced their specific bug is exactly the thing aggregation throws away. This is where a captured bug report becomes observability at the single-session level.
For a specific reported bug, BugMojo's browser extension captures the failing session as an rrweb session replay alongside the console output and the network requests that ran during it. That bundle is the definitive answer to 'what exactly happened to this one user': the props on screen, the click that triggered it, and the GET /api/plan response whose new field the UI never handled. It is the reproduction that a p99 latency chart can never give you. It is observability scoped to a single session instead of a fleet.
To place BugMojo against the broader tooling landscape: aggregate front-end observability platforms and session-replay tools each cover part of this, and the trade-offs differ by vendor. Our rundown of the best session replay tools of 2026 and the head-to-head Sentry vs LogRocket comparison walk through where each sits. BugMojo's wedge is that the single-session bundle is built to be handed to an AI coding agent, so the agent reads the captured state behind one bug rather than an aggregate dashboard.
| Feature | Question you are asking | Aggregate telemetry (metrics/traces/logs) | BugMojo captured session |
|---|---|---|---|
| Is something wrong across the fleet? | No | ✓ | No |
| Where in the request path did it fail? | No | ✓ | For one session |
| What exactly did this one reported user experience? | No | No | ✓ |
| rrweb replay + console + network for one bug | No | No | ✓ |
| The captured bundle handed to an AI coding agent | No | No | ✓ |
BugMojo captures the failing session with its rrweb replay, console, and network (the definitive record of what one user actually experienced), then hands the whole bundle to Claude Code or Cursor over MCP.
Install the extensionFrequently asked questions
Frequently asked questions
Sources
- Observability Primer: understanding the internal state of a system by examining its telemetry signals (OpenTelemetry), OpenTelemetry (2026)
- The three pillars of observability: logs, metrics, and traces (IBM), IBM (2026)
- Monitoring Distributed Systems: monitoring vs observability foundations (Google SRE Book), Google SRE Book (2026)
- What is OpenTelemetry: the vendor-neutral standard for telemetry (OpenTelemetry), OpenTelemetry (2026)
Get bug-tracking insights, weekly.
Engineering deep-dives, QA playbooks, and honest tool comparisons. No spam. Unsubscribe in one click.