

What Are Core Web Vitals? LCP, INP and CLS Explained Simply
Core Web Vitals are three field metrics Google uses to score loading (LCP), responsiveness (INP), and visual stability (CLS). Here is what each measures, the current 2024 thresholds, and why a janky page is really a reproducible bug.
Definition
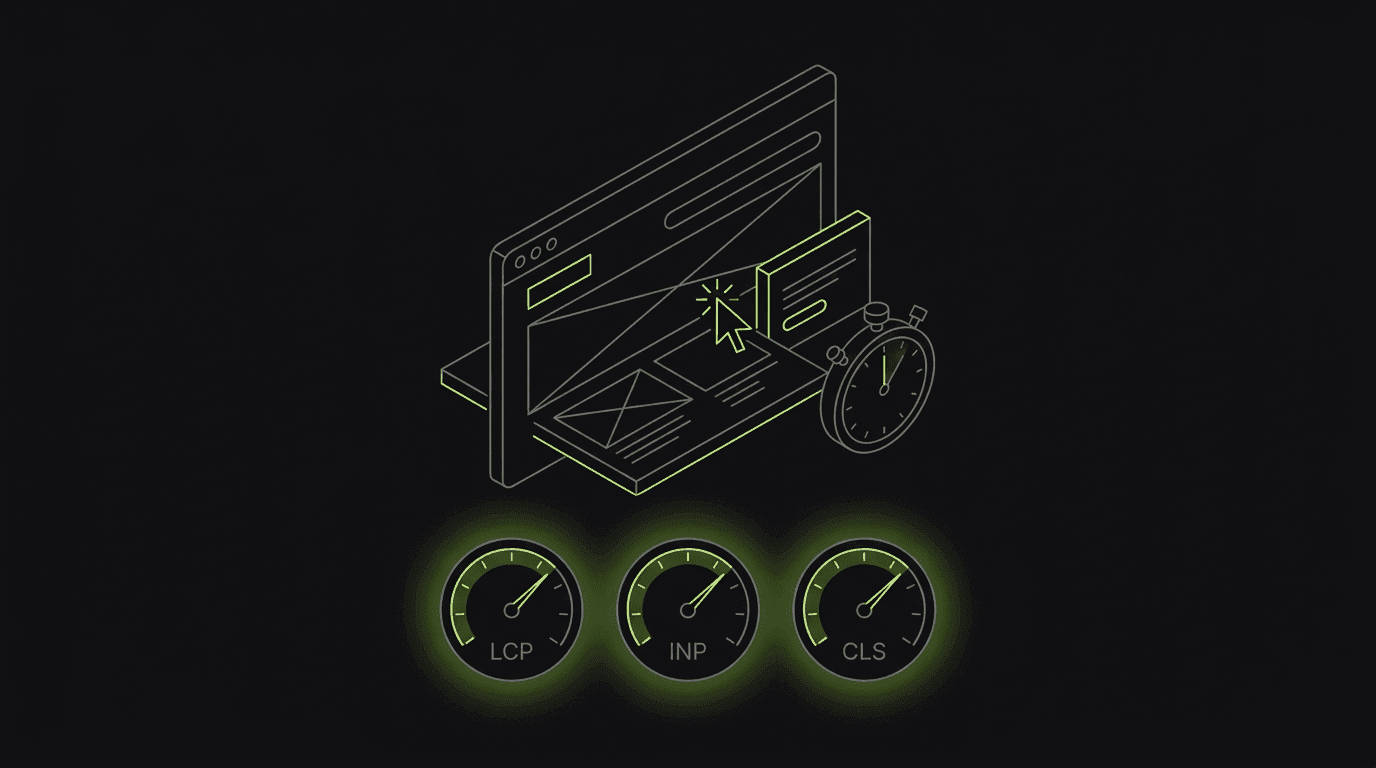
Core Web Vitals are three Google metrics that score real-user experience: Largest Contentful Paint measures loading, Interaction to Next Paint measures responsiveness, and Cumulative Layout Shift measures visual stability. Each is judged at the 75th percentile of field data, split across mobile and desktop, so a page passes only when most visits hit the good threshold.
Core Web Vitals are the subset of web performance metrics Google considers essential for every page. The full list of Web Vitals is large, but only three carry the ‘core’ label and feed Google's ranking signals. Each maps to a distinct part of how a page feels: LCP answers ‘did the main content load fast?’, INP answers ‘did the page respond quickly when I tapped?’, and CLS answers ‘did the layout stay put while I read?’. They are deliberately user-centric: they describe perception, not server internals.
Why it matters
Two things make Core Web Vitals worth understanding precisely. First, they are field metrics, not lab scores. Google assesses each one at the 75th percentile of real-user page loads, segmented across mobile and desktop, which means a page passes only when 75% of actual visits meet the good threshold. A fast result in Lighthouse on your laptop proves nothing if a quarter of real visitors on mid-tier phones are having a bad time. Second, they are hard to pass at scale. In the Web Almanac 2024, only 43% of mobile origins and 54% of desktop origins passed all three vitals, with mobile LCP the bottleneck at just 59% ‘good’ versus 74% for INP and 79% for CLS.
The ranking effect is real but modest. Core Web Vitals feed Google's page-experience signals, which behave like a tiebreaker between pages of comparable relevance rather than a dominant factor. Excellent content still ranks with middling vitals, and flawless vitals will not save thin pages. The larger, more reliable payoff is user behavior: a slow LCP, a laggy INP, or a jumpy CLS measurably raises bounce and abandonment regardless of where you rank. That is the honest reason to care: the metrics are a proxy for whether the page is frustrating to use.

LCP: Largest Contentful Paint (loading)
LCP measures loading speed, specifically the render time of the largest image or text block visible in the viewport. Per the LCP documentation, good is 2.5 seconds or less, needs-improvement is 2.5 to 4.0 seconds, and poor is above 4.0 seconds. The ‘largest contentful’ element is usually a hero image, a video poster frame, or a big heading. Common causes of a slow LCP are an oversized unoptimized image, a slow server response, render-blocking CSS or JavaScript, and lazy-loading the very element that should appear first. LCP is the metric most sites fail on mobile, because phones combine slower networks with smaller CPUs.
INP: Interaction to Next Paint (responsiveness)
INP replaced First Input Delay (FID) as the responsiveness vital on March 12, 2024, after being experimental since May 2022 and pending since May 2023. The change matters because INP is stricter. FID only measured the delay before the browser started processing your first interaction; INP measures the full latency of every click, tap, and keypress all the way through to the next painted frame, then reports a representative worst case. Per the INP docs, good is 200 ms or less, needs-improvement is above 200 up to 500 ms, and poor is above 500 ms. INP only counts clicks, taps, and keyboard input. It ignores hover, scroll, and zoom. Many sites that quietly passed FID now fail INP because a long task or heavy event handler blocks the main thread after the click registers.
CLS: Cumulative Layout Shift (visual stability)
CLS measures visual stability: how much the page jumps around while it loads and while you interact with it. Unlike the others, it is a unitless score, not a time. Per the CLS documentation, good is 0.1 or less and poor is above 0.25. Each individual layout shift score is impact fraction × distance fraction, using the largest dimension of the viewport as the denominator. In plain terms: how much of the screen moved, multiplied by how far it moved. Typical culprits are images and ads without reserved width and height, web fonts that swap and reflow text, and content injected above what the user is already reading. CLS is the vital most people feel as a bug: you go to tap a button and an ad shoves it out from under your finger.
How this shows up in a real BugMojo bug report
Here is the gap nobody else closes. Field tools tell you that a page is slow or janky; they almost never tell you why or where. A CrUX percentile is an aggregate (‘your INP is 480 ms at p75’) with no path back to the click that froze, the handler that blocked, or the element that shifted. You are left guessing in the lab and hoping the field number moves 28 days later. That round-trip is the real cost of treating a vital as a score instead of a defect.
A session replay turns the abstract number into a concrete repro. Because BugMojo's browser extension records the actual DOM (via rrweb) rather than pixels, you can watch a card slide down 80 pixels at the exact moment a user taps. That is your CLS, made visible. You can see the UI freeze for half a second after a click while a long task runs. That is your INP, made visible. The replay is timestamped against the same console logs and network requests captured in that one session, so a slow LCP traces straight to the 3.2 MB hero image or the API call that blocked first paint.
The wedge is what happens next. BugMojo bundles that replay, the console output, the network timeline, and a screenshot into a single structured bug report, then exposes it to an AI coding agent through an MCP server. An agent like Claude Code or Cursor can read the report, see that a 540 ms INP coincides with a specific long task in a specific handler, and propose a fix: debounce the handler, defer the work, reserve the image dimensions. The CrUX percentile becomes an actionable ticket with full reproduction context. No competitor connects a failing field vital to a single reproducible replay that an AI agent can triage over MCP; the rest stop at metric dashboards and lab advice.
| Feature | Capability | BugMojo | Field/lab CWV tools (CrUX, PageSpeed, Lighthouse) |
|---|---|---|---|
| Reports LCP / INP / CLS numbers | No | Per captured session | ✓ |
| DOM session replay of the jank or freeze | No | ✓ | No |
| Replay bundled with console + network in one report | No | ✓ | No |
| Report handed to an AI agent over MCP | No | ✓ | No |
| Continuous 75th-percentile field monitoring (CrUX) | No | No | ✓ |
| Synthetic lab audits with optimization scores | No | No | ✓ |
Capture the exact session where INP froze or the layout shifted, with console and network attached, and hand it to your AI agent.
Install the extensionFrequently asked questions
Frequently asked questions
Sources
- Web Vitals overview: LCP/INP/CLS thresholds and the 75th-percentile method, web.dev (Google) (2024)
- INP officially replaces FID as a Core Web Vital on March 12, 2024, web.dev (Google) (2024-03-12)
- Interaction to Next Paint (INP): definition and thresholds (good 200 ms, poor >500 ms), web.dev (Google) (2024)
- Cumulative Layout Shift (CLS): definition, formula, and causes, web.dev (Google) (2024)
- Largest Contentful Paint (LCP): definition and thresholds (good 2.5 s, poor >4.0 s), web.dev (Google) (2024)
- Web Almanac 2024 Performance chapter: Core Web Vitals pass rates, HTTP Archive Web Almanac (2024)
- How the Core Web Vitals thresholds were defined, web.dev (Google) (2024)
Get bug-tracking insights, weekly.
Engineering deep-dives, QA playbooks, and honest tool comparisons. No spam. Unsubscribe in one click.