

What Is a Console Log? How Browser Logs Help You Fix Bugs
A console log is a line your code writes to the browser's console. Here is what the console API does, why an error log carries a stack trace a plain log does not, and why that output stays trapped in the user's tab.
Definition
A console log is a line of diagnostic output your code writes to the browser's console, usually with console.log(). The console is the developer panel built into every browser that displays these messages, JavaScript errors, and warnings as they happen, so you can see what your code is actually doing.
The console is an object, and logging is just calling its methods. MDN documents that the console object is available in any global scope (a page, a web worker, even Node.js) and exposes log(), info(), warn(), error(), and debug(), among others. The API started life as a browser convention and is now specified: the WHATWG Console Standard (a Living Standard, last updated 15 March 2026) formally defines log, info, warn, error, debug, assert, and trace. So when people say "add a console log," they mean: call one of those methods and read the result in the Console tab of DevTools.
Why it matters
The reason the console is the first tool every developer reaches for is that the methods are not interchangeable: they carry severity. Chrome DevTools assigns each console.* method a level (Verbose, Info, Warning, or Error), so console.log is Info-level and console.error is Error-level. That is not cosmetic. When a page misbehaves and the Console is a wall of noise, the Log Levels drop-down lets you hide everything but Error and read only what broke. Severity is what makes a busy console searchable.
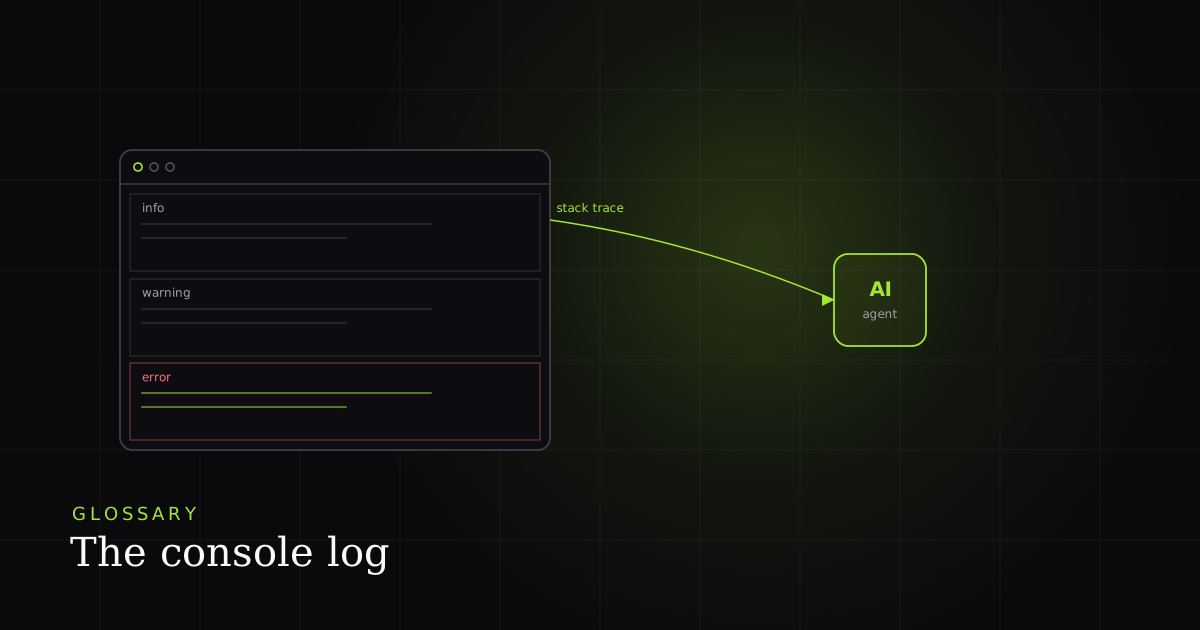
The single most useful difference is the stack trace. A console.log prints a value and nothing more. A console.error, per MDN, "may be formatted as an error, with red colors and call stack information", and Chrome's Console API reference is blunter: console.error "Prints object to the Console, formats it as an error, and includes a stack trace." That trace is the ordered list of function calls that were open at the moment of the failure, so an error log tells you not just what went wrong but the path the code took to get there. A plain log stays lightweight and omits it; if you want a trace without an error, call console.trace() explicitly.

How this shows up in a real BugMojo bug report
Here is the catch that the standard docs never mention: a console message lives only in the browser tab that produced it. When a user hits a bug in production, the console.error and its stack trace sit in their DevTools, not yours, and they are gone the instant the tab closes or the page navigates. That is the whole anatomy of a "cannot-reproduce" ticket: the silent error logged something genuinely useful, but the output never left the user's machine. Locally you run different data and a clean state, so the error simply never fires for you.
BugMojo closes that gap by capturing the console where the failure actually happens. The browser extension records the page as an rrweb session replay and captures the console output and network requests alongside it, so the red console.error arrives in the bug report next to the click that triggered it and the exact API response that fed the bad data. The trace is no longer trapped in a tab you can't see. Then the BugMojo MCP server hands that whole bundle to an AI coding agent (Claude Code, Cursor), and an agent reading the real error beats one guessing from a vague description. That distinction is expensive at scale: in the 2025 Stack Overflow Developer Survey, 66% of developers named "AI solutions that are almost right, but not quite" their biggest frustration, and 45.2% said debugging AI-generated code is more time-consuming. Feeding the agent the captured console over the Model Context Protocol (an open standard for connecting AI applications to external data and tools) is how you stop it from guessing.
| Feature | Capability | BugMojo | DevTools console alone |
|---|---|---|---|
| See console.log / warn / error live while debugging | No | ✓ | ✓ |
| console.error stack trace captured in the bug report | No | ✓ | Only in the user's own tab |
| Console persisted with an rrweb replay of the session | No | ✓ | No |
| Console + network travel with the report to your team | No | ✓ | No |
| Console handed to an AI agent over MCP | No | ✓ | No |
| Aggregate uncaught errors across a production fleet | No | No | No |
BugMojo captures the console with an rrweb replay and the network requests, then serves the whole bundle to Claude Code or Cursor over MCP, so your agent reads the real error and its stack trace instead of a vague repro.
Install the extensionFrequently asked questions
Frequently asked questions
Sources
- console: Web APIs (the console object is available in any global scope; log/info/warn/error/debug methods), MDN / Mozilla (2026)
- console: error() static method (outputs at the "error" log level; may be formatted with red colors and call stack information), MDN / Mozilla (2026)
- Console features reference: Preserve Log, severity levels (Verbose/Info/Warning/Error), the Log Levels filter, Google / Chrome for Developers (2025)
- Console API reference: console.error "Prints object to the Console, formats it as an error, and includes a stack trace", Google / Chrome for Developers (2025)
- Console Standard (the WHATWG Living Standard that defines log, info, warn, error, debug, assert, trace), WHATWG (2026-03-15)
- Model Context Protocol: open standard for connecting AI applications to external systems, Anthropic / MCP (2025)
- 2025 Stack Overflow Developer Survey, AI section ("almost right, but not quite" 66%; debugging AI code 45.2%), Stack Overflow (2025)
Get bug-tracking insights, weekly.
Engineering deep-dives, QA playbooks, and honest tool comparisons. No spam. Unsubscribe in one click.