

How to Fix a 502 Bad Gateway Error
A 502 is not your browser's fault, and it usually isn't the gateway's either. It means a proxy got a broken answer from the server behind it. Here is how to find which layer failed and fix it.
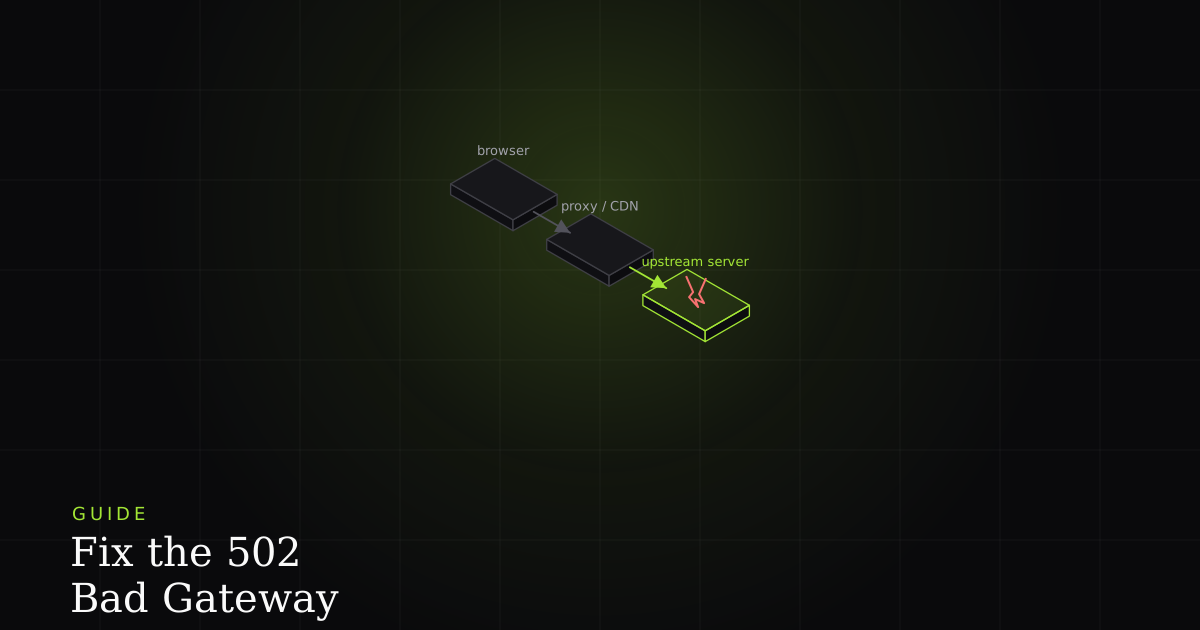
A 502 Bad Gateway is one of the most misread errors on the web, because the machine that reports it is almost never the machine that's broken. The status comes from a middleman (a reverse proxy, a load balancer, a CDN, or an API gateway) that accepted your request just fine, tried to hand it off to the real application behind it, and got an answer it couldn't use. Understanding that one fact turns a vague "the site is down" into a precise question: which hop failed, and why?
What a 502 actually means
A 502 Bad Gateway is returned by a server acting as a gateway or proxy when it receives an invalid or empty response from the upstream server it forwarded the request to. The gateway is reachable and working; the application behind it is what failed. The failing hop is between the proxy and your app, never between the browser and the proxy.
Picture the request as a relay. Your browser talks to the edge, say Cloudflare or an Nginx reverse proxy. That edge doesn't run your application; it forwards the request to an upstream: your Node process, a container, a Kubernetes service, a PHP-FPM pool. When the upstream replies with something the proxy can't parse (a truncated response, an empty body, a dropped connection, garbage bytes), the proxy has no valid answer to relay back. So it synthesises one: 502 Bad Gateway. The code is the proxy's way of saying "I did my job, but the server I depend on gave me nonsense."
This is the single most useful mental model for debugging a 502: the error is a message about the upstream, generated by the gateway. Everything that follows is about locating which upstream, and figuring out what it sent instead of a real response.
The common causes
In rough order of how often they turn up in real incidents:
- The upstream app is down, crashed, or restarting. A deploy is mid-rollout, the process exited, or the container is still booting. The proxy connects to a port with nothing listening, or something that dies mid-response.
- The upstream timed out. If the proxy gives up waiting you usually get a
504 Gateway Timeoutinstead, but some proxies surface a slow, half-closed connection as a 502. The distinction matters; more on that below. - The process died from memory pressure (OOM). The kernel's OOM killer terminates your app mid-request; the proxy sees the socket close with no valid response.
- Wrong upstream address or port in the proxy config. A
proxy_passpointing at127.0.0.1:3000when the app now listens on:8080produces a 502 on every request. - Malformed responses or a closed connection. The app writes invalid headers, sends a body that doesn't match its
Content-Length, or resets the connection before finishing. - TLS or handshake failures between proxy and upstream. If the proxy speaks HTTPS to the upstream and the certificate, protocol, or SNI doesn't match, the handshake fails and the proxy reports a bad gateway.
- Scaling and cold starts. Serverless functions and autoscaled pods that are still spinning up can refuse or drop connections during the cold-start window.
How to diagnose it
Debugging a 502 is a process of elimination across the relay. The goal is to find the exact hop that broke, and you do that by testing each link independently instead of guessing.
1. Confirm the upstream is actually running and healthy. Before touching the proxy, check that your application process is alive, listening on the expected port, and answering its own health check. A surprising share of 502s are simply an app that isn't running.
2. Read both logs: the proxy's and the app's. The proxy log tells you what the gateway saw; the app log tells you what the upstream did (or that it never got the request at all). For Nginx the relevant file is the error log, which records the upstream address and the reason the connection failed.
# Watch Nginx's error log while you reproduce the request
tail -f /var/log/nginx/error.log

# A classic 502 line looks like this — note the upstream address and reason:
# connect() failed (111: Connection refused) while connecting to upstream,
#   upstream: "http://127.0.0.1:3000/", host: "app.example.com"
#
# "Connection refused" => nothing is listening on that port (app down / wrong port)
# "upstream prematurely closed connection" => the app died mid-response (often OOM)
3. Curl the upstream directly to bypass the proxy. This is the fastest way to isolate the failing layer. If you hit the application's own address and it answers correctly, the proxy or its config is at fault. If it fails or hangs the same way the proxy does, the problem is the app itself.
# Hit the app directly, skipping the reverse proxy / load balancer entirely.
# Run this from the proxy host (or wherever the proxy connects from).
curl -i http://127.0.0.1:3000/health

# Healthy upstream => the app is fine; suspect the proxy config or the hop to it.
#   HTTP/1.1 200 OK
#   content-type: application/json
#
# Connection refused => the app isn't listening there (down, crashed, wrong port).
#   curl: (7) Failed to connect to 127.0.0.1 port 3000: Connection refused

# Also inspect ONLY the headers of the public URL to see which proxy answered:
curl -sI https://app.example.com/ | grep -iE 'server|via|cf-ray|x-served-by'
4. Check the proxy's timeout and upstream settings. If the app is slow rather than dead, the fix may be a larger read timeout, or, better, making the app faster. Here is the Nginx block that governs both where requests go and how long the proxy waits before declaring failure.
upstream app_backend {
  server 127.0.0.1:3000;   # must match where your app actually listens
}

server {
  location / {
    proxy_pass http://app_backend;

    # How long the proxy waits for the upstream at each stage.
    proxy_connect_timeout 5s;   # time to establish the TCP connection
    proxy_send_timeout    30s;  # time to send the request
    proxy_read_timeout    60s;  # time to read the response (raise for slow apps)
  }
}
5. Look at recent deploys. If a 502 started at a specific minute, correlate it with a deploy, a config change, a scaling event, or a dependency (database, cache) going down. The timeline is often the whole diagnosis: something changed, and the upstream stopped answering cleanly right after.
502 vs 504 vs 503 vs 500
These four codes get conflated constantly, but each points you at a different failure and a different fix. Getting the distinction right saves you from debugging the wrong layer.
- 502 Bad Gateway: the gateway got a bad response from the upstream. The app answered, but with something invalid or empty (or the connection dropped). Fix the upstream's response.
- 504 Gateway Timeout: the gateway got no response in time. The upstream is too slow or hung. Speed up the app or raise the timeout deliberately. The difference from a 502 is response-vs-no-response: broken answer versus no answer.
- 503 Service Unavailable: the server is temporarily unable to serve the request, because it is overloaded, in maintenance, or a load balancer has no healthy backends to route to. It's a capacity or availability signal, not a broken hop.
- 500 Internal Server Error: the application itself threw an unhandled error while producing a response. This is a bug in your code or a failed dependency inside the app, not a proxy problem. If you're chasing a 500, the guide on fixing a 500 Internal Server Error is the right place to start.
A quick way to remember it: 500 is the app failing on its own, while 502, 503, and 504 are all reported by something in front of the app. Among those three, 502 is a bad answer, 504 is no answer in time, and 503 is "not right now." If you want the full map of every status class, the HTTP status codes explained reference lays them out side by side.
Fixing it for good
Once you've isolated the failing hop, the fix follows directly from the cause. If the app was down or crashing, the real work is keeping it up: add a process supervisor or health-checked orchestration that restarts it, and fix whatever killed it (often an out-of-memory condition or an unhandled crash). If the OOM killer is involved, either raise the memory limit or fix the leak; a 502 that recurs on a schedule is frequently memory that climbs until the process is reaped.
If the config was wrong, align the proxy's proxy_pass and upstream block with where the app actually listens, and treat that config as something to test in CI rather than edit by hand in production. If the app was merely slow, resist the urge to just crank proxy_read_timeout to a huge number. That trades a fast 502 for a slow-loading page and hides the real regression. Profile the slow path, and raise the timeout only as a deliberate allowance for work that genuinely takes that long. And if cold starts are the culprit, warm the pool: keep a minimum number of instances alive, or add readiness checks so the load balancer doesn't route to a pod that hasn't finished booting.
Install the free BugMojo extension and capture the exact failed request (its host, status, and response headers) so you know whether the CDN, the load balancer, or your app produced the 502 instead of guessing.
Install the free extensionFrequently asked questions
Frequently asked questions
Sources
- 502 Bad Gateway (MDN reference): the server, while acting as a gateway or proxy, received an invalid response from the upstream server, MDN Web Docs (2026)
- 504 Gateway Timeout (MDN reference): the gateway did not get a response in time from the upstream server, MDN Web Docs (2026)
- HTTP response status codes (MDN reference): the full list of 1xx to 5xx codes and what each class signals, MDN Web Docs (2026)
- RFC 9110: HTTP Semantics, the normative definitions of 502, 503, and 504 gateway status codes, IETF RFC 9110 (2022)
Get bug-tracking insights, weekly.
Engineering deep-dives, QA playbooks, and honest tool comparisons. No spam. Unsubscribe in one click.