

How to Debug a Memory Leak in JavaScript
A memory leak is retained memory the garbage collector can't reclaim because something still references it. Here are the common causes, the Chrome DevTools three-snapshot technique, and the fixes mapped to each one.
A memory leak is one of the hardest bugs to pin down because nothing crashes at the moment it happens. The page just gets slower the longer it stays open, and by the time anyone notices, the interaction that caused it scrolled off the screen twenty minutes ago. This guide is the hands-on companion to our definition of a memory leak: less about what a leak is and more about the exact workflow for finding one, from the Chrome DevTools Memory panel to the fixes that map to each cause.
What a JavaScript memory leak actually is
A JavaScript memory leak is memory that stays retained and cannot be garbage-collected because something still references it, even though your code no longer needs it. The collector frees only objects it can prove are unreachable from the root, so a single forgotten reference keeps the whole object graph alive and the heap grows for the life of the page.
Every object you create lives on the heap, and the engine reclaims it automatically with a mark-and-sweep collector that starts from a set of roots and frees anything it cannot reach by following references. A leak is not the collector failing. It is the collector working exactly as designed on a graph where your data is still reachable through a path you forgot about. You cannot force a collection from JavaScript, so the only lever you have is reachability: remove the last reference and the memory is eligible to be freed. That single fact shapes both the debugging and the fix.
The common causes, in code
Almost every front-end leak is one half of a missing pair: you registered something on the way in and never unregistered it on the way out. Learn to spot these six shapes in review and you will catch most leaks before a profiler ever gets involved.
- Event listeners never removed. You call
addEventListenerbut never the matchingremoveEventListener, so the handler closure (and everything it captured) stays alive as long as the target does. - Detached DOM nodes still referenced. You remove an element from the page, but a variable, array, or cache still points at it. Because a child holds a reference to its parent, one held node can pin an entire subtree.
- Globals, caches, and Maps that grow without eviction. An array you only ever
pushto, or aMapkeyed by user id with no eviction, is a leak with a slow fuse. - Closures capturing large scope. A closure stored somewhere durable that closes over a big object keeps that object reachable indefinitely.
- Timers and intervals not cleared. A
setIntervalwhose callback references state, never paired withclearInterval, leaks on every tick forever. - React-specific leaks. A
useEffectthat subscribes but returns no cleanup, or a subscription that keeps callingsetStateafter unmount.
// LEAK: the listener and interval are never torn down.
function startDashboard() {
  const cache = [];
  window.addEventListener('resize', onResize);          // never removed
  setInterval(() => cache.push(readMetrics()), 1000);   // never cleared, array only grows
}

// FIX: keep the handles and tear everything down on teardown.
function startDashboard() {
  const onResize = () => layout();
  window.addEventListener('resize', onResize);
  const id = setInterval(sampleMetrics, 1000);

  return function stop() {
    window.removeEventListener('resize', onResize);
    clearInterval(id);
  };
}// LEAK: the removed row is still referenced by a module-level Map,
// so the whole detached subtree can never be collected.
const rowCache = new Map();
function renderRow(id, data) {
const el = document.createElement('tr');
rowCache.set(id, el); // strong reference
return el;
}
function removeRow(id) {
document.querySelector(`#row-${id}`)?.remove(); // gone from the DOM...
// ...but rowCache still holds it — detached DOM node leak.
}
// FIX: drop the reference when you drop the node.
function removeRow(id) {
document.querySelector(`#row-${id}`)?.remove();
rowCache.delete(id);
}The Chrome DevTools debugging workflow
Once you suspect a leak, stop guessing and run a controlled experiment in the Chrome DevTools Memory panel. The Chrome team draws a sharp diagnostic line first: a page whose performance gets progressively worse over time points to a leak, while one that is consistently slow points to memory bloat. The progressive-degradation curve is the leak signature, and confirming it before you profile saves you from chasing the wrong problem.
The three-snapshot technique
This is the single most reliable way to isolate a leak, and it works because a leak is an allocation that repeats and never frees:
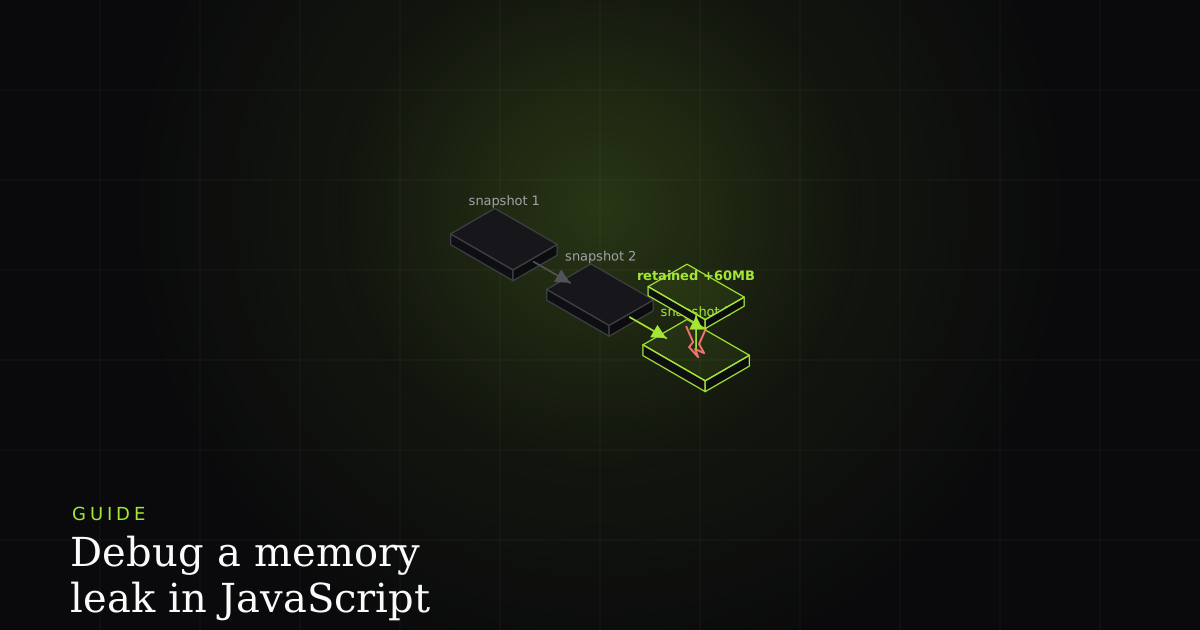
- Snapshot one. Load the page to a stable state and record a heap snapshot as your baseline.
- Exercise the suspect, repeatedly. Perform the interaction you suspect several times: open and close a modal ten times, navigate a route back and forth, mount and unmount a list. Repetition is what makes a real leak grow linearly and stand out from one-off allocations.
- Snapshot two, then compare. Record again and switch to the Comparison view. Sort by retained size and read the Objects allocated between snapshots delta: anything created during your repeated interaction and still alive is a leak candidate. Select it and read the Retainers pane at the bottom. That chain is the reference keeping it alive, and it is your bug.
To hunt detached nodes specifically, type Detached into the Class filter; the retainer chain will name the variable, array, or Map still pointing at the removed element.
Allocation instrumentation and the Performance monitor
Two other tools sharpen the picture. Allocation instrumentation on timeline (in the Memory panel) records allocations as they happen and draws blue bars for memory that survived to the end of the recording. The tall bars left standing after your interaction are exactly what leaked, and clicking one jumps to the allocating call stack. Separately, the Performance monitor (Command Menu → "Show Performance Monitor") plots a live JS heap size graph. Confirm a leak the honest way: interact with the page, then force garbage collection and watch the line. In a healthy app the heap sawtooths: it climbs, then drops back to baseline after each collection. In a leaking app the baseline ratchets upward and never returns, no matter how many times GC runs. That rising floor is your proof.
Fixes mapped to each cause
Every fix is the same shape (release the last reference), but the mechanism differs by cause. Listeners get a matching removeEventListener (or an AbortSignal so they clean up in one call). Timers get clearInterval/clearTimeout. Detached nodes get their cache entry deleted alongside the DOM removal. And for caches and per-object metadata, the durable fix is to stop holding strong references at all: a WeakMap holds its keys weakly, so when the key object is otherwise unreachable, the collector is free to reclaim both the key and its cached value with no manual eviction.
// FIX for a growing cache: WeakMap lets entries disappear with their key.
// When the node is removed and nothing else references it, the collector
// reclaims the node AND its cached metadata automatically.
const measurements = new WeakMap();

function measure(node) {
  if (!measurements.has(node)) {
    measurements.set(node, node.getBoundingClientRect());
  }
  return measurements.get(node);
}

// FIX for React: every subscription in an effect returns its cleanup.
function useLiveData(channel) {
  useEffect(() => {
    const sub = client.subscribe(channel, onMessage);
    const id = setInterval(poll, 5000);
    // The cleanup runs on unmount AND before every re-run —
    // no stale subscription, no orphaned interval.
    return () => {
      sub.unsubscribe();
      clearInterval(id);
    };
  }, [channel]);
}
For collections you genuinely want to iterate but still let go of, reach for a WeakRef or the entry-holding WeakSet. The rule that ties all of this together: bind every subscription (listeners, timers, fetches, observers) to a single cancellation token like an AbortController, and wire that token's abort() into your framework's teardown hook once. After that, cleanup is the default rather than a step you can forget, and the class of leak that comes from forgetting simply disappears.
Install the free BugMojo extension and capture the degrading session (replay, console, and network) so you see the exact repeated interaction that grew the heap, instead of guessing from a single snapshot.
Install the free extensionFrequently asked questions
Frequently asked questions
Sources
- Memory management (MDN reference): the heap, reachability, mark-and-sweep, and why you cannot manually trigger garbage collection, MDN Web Docs (2026)
- Fix memory problems (Chrome DevTools): memory leak vs. bloat, the Memory panel, and the Performance monitor JS heap graph, Chrome DevTools (2026)
- Record heap snapshots (Chrome DevTools): the comparison view, objects allocated between snapshots, retainers, and the Detached filter, Chrome DevTools (2026)
- WeakMap (MDN reference): weakly held keys for caches and per-object metadata that the collector can reclaim automatically, MDN Web Docs (2026)
Get bug-tracking insights, weekly.
Engineering deep-dives, QA playbooks, and honest tool comparisons. No spam. Unsubscribe in one click.