

MTTR: How to Measure and Reduce Mean Time to Resolution
MTTR is a DORA stability metric, but it hides an ambiguity and a bottleneck. It means four different things, and the segment that dominates is almost never the fix itself. Here's how to measure it honestly and cut the part that actually costs you hours.
MTTR is one of the most cited reliability numbers in engineering, and one of the most quietly misleading. Two teams can both report an MTTR of "four hours" and mean completely different things, because the acronym stands for at least four separate metrics measuring four different spans of an incident. And even once you pin down the definition, the number usually hides where the time actually goes: not in writing the fix, but in figuring out what broke.
This playbook does three things: defines MTTR precisely, shows you how to measure it without fooling yourself, and walks through each segment of the incident timeline with the honest question of which one to cut first. Spoiler from someone who has run a lot of incident reviews: for most teams, it's diagnosis, and specifically reproduction.
What MTTR actually means (and the four-way ambiguity)
MTTR is used interchangeably for Mean Time To Repair, Recover, Resolve, and Respond, each measuring a different span of an incident. This post uses MTTR as the mean time from a defect or incident being detected to service being restored. Always state which definition you mean before comparing your number with anyone else's.
The four common expansions aren't interchangeable. Mean Time To Respond measures detection to acknowledgement: how fast a human picks up the page. Mean Time To Repair is the hands-on-keyboard duration of the fix itself. Mean Time To Recover (or Restore) runs from detection until service is healthy again. Mean Time To Resolve is the widest, extending through verification and ticket closure. If you benchmark your "MTTR" against an industry figure without checking which span it covers, you're comparing numbers that don't share a definition.
DORA (Google's DevOps Research and Assessment program) historically called this metric mean time to recover or time to restore service. In 2023 the team refined it to failed deployment recovery time, narrowing the scope to failures caused by a change so the metric isolates change-induced instability rather than every incident type. That refinement matters if you're tracking DORA formally, but the operational question for most teams is broader: when something breaks in production, how long until users are okay again? That's the span this playbook optimizes.
Why MTTR matters
MTTR is one of the four DORA keys, sitting alongside deployment frequency, lead time for changes, and change failure rate. The first two measure throughput: how fast you ship. MTTR and change failure rate measure stability: what happens when shipping goes wrong. A team that deploys fifty times a day but takes a week to recover from each failure isn't elite; it's fragile at speed.
The performance spread is stark. According to DORA's research, elite performers restore service in under an hour, high performers in under a day, medium performers in under a week, and low performers take anywhere from a week to a month. That's not a 20% difference between the top and bottom. It's two to three orders of magnitude. MTTR is where reliability is won or lost, and it compounds: every hour of restore time is user-facing downtime, on-call fatigue, and eroded trust.
How to measure MTTR
The formula is simple: for each incident, take the resolved timestamp minus the detected timestamp, sum those durations across all incidents in the period, and divide by the number of incidents.
MTTR = Σ (resolved − detected) / number of incidents
The subtlety is in the timestamps, and this is where teams quietly cheat. If "detected" is when a human filed the ticket rather than when the system first degraded, you've excluded the entire time-to-detect gap and your MTTR looks artificially good. Be consistent: pick the earliest reliable signal of the incident as the start, and service-restored (not just "deployed a fix") as the end.
Because MTTR is a mean, one nightmare incident can dominate the average and mask a lot of fast recoveries. Track the median and p90 alongside it so you can see the distribution instead of a single skewed number.
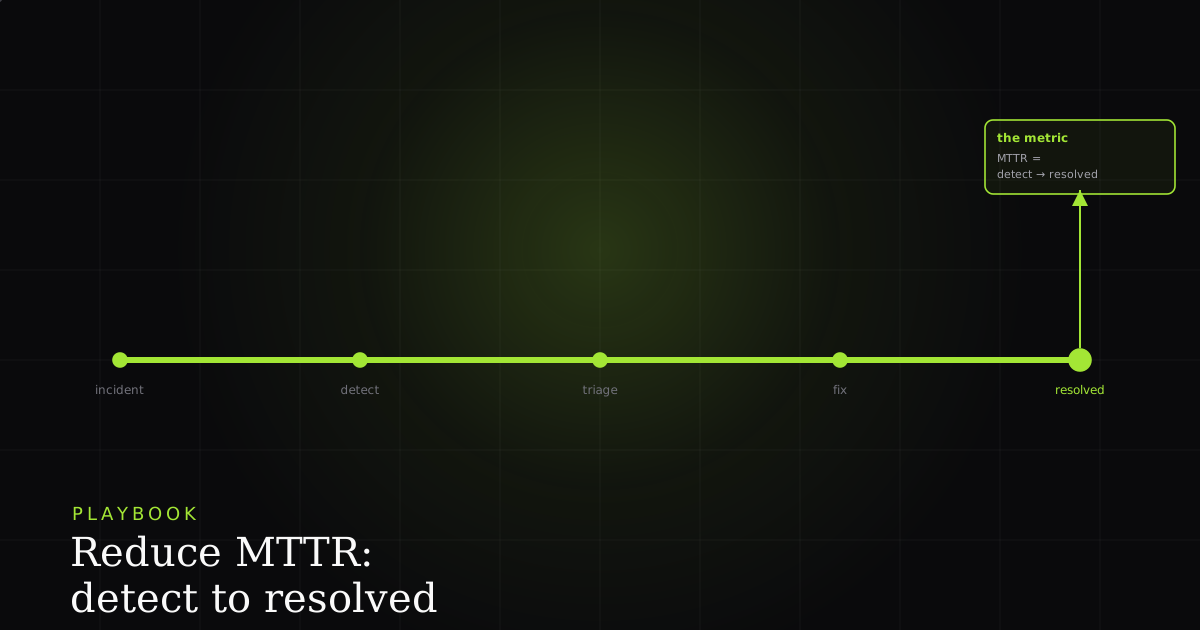
To improve MTTR you have to break the incident into its segments, because you cut MTTR by shrinking whichever segment dominates, not by working faster in general. A typical timeline looks like this: an incident occurs, it's detected, someone acknowledges and triages it, it gets diagnosed (root cause found and reproduced), a fix is written, the fix is verified, and the incident is resolved. Each arrow is a stopwatch you can measure and attack independently.
The segments, and how to cut each one
1. Detection. The clock you often forget to start. If your monitoring only alerts after users complain, you've already lost the cheapest minutes. Better instrumentation (health checks, error-rate alerts, synthetic monitoring, real-user monitoring) shrinks time-to-detect and, because detection is the start of the whole span, every minute saved here is a minute off MTTR directly.
2. Triage. The time between an alert firing and someone owning it. This is where ambiguity kills you: unclear severity, no defined on-call owner, five people half-looking while assuming someone else has it. Clear severity levels and explicit ownership shrink time-to-acknowledge. We wrote a full method for this in how to triage production bugs in 15 minutes. The short version is that a triaged, owned, severity-tagged incident moves; an un-owned one sits.
3. Diagnosis and reproduction: the big one. This is almost always the largest and most variable segment, and it's where MTTR is really made or lost. The hard part of most incidents isn't writing the fix; it's understanding what broke, and you can't understand what you can't reproduce. When a production bug arrives as "checkout is failing for some users," an engineer can burn hours trying to recreate the exact state (which account, which browser, which feature flag, which sequence of clicks, what the network returned) before they can even see the failure themselves. That "I can't reproduce it" back-and-forth is the single most expensive stretch of the whole timeline, and it's pure guesswork tax.
This is where captured context collapses hours into minutes. If the moment of failure was recorded (a DOM session replay of exactly what the user did, plus the console errors and the network requests that fired), the engineer skips reproduction entirely and goes straight to diagnosis. They watch the failure happen, read the actual stack trace, and see the real request that 500'd. The variable, unbounded reproduction step becomes a fixed, short one. For most teams this is the highest-leverage change available on MTTR, because it attacks the segment that dominates the average.
4. Fix and verify. Once the cause is understood, the fix is often quick, but two disciplines protect your MTTR here. First, link the fix directly to the incident ticket (commit, PR, and deploy referencing the incident) so there's a clean audit trail and no confusion about what shipped for what. Second, verify before closing: confirm the fix actually restored service in production, not just that it merged. Closing on "the PR is in" rather than "users are okay again" is how an incident gets reopened an hour later, doubling its real MTTR.
Pair MTTR with a blameless postmortem
Measuring MTTR tells you how long incidents take; it doesn't tell you why, and it won't improve on its own. The mechanism that actually drives the number down over time is the follow-up: after each significant incident, run a blameless postmortem that asks which segment consumed the most time and what would have shortened it. Was detection slow because a signal was missing? Did triage stall because ownership was unclear? Did diagnosis take three hours because nobody could reproduce it?
Done blamelessly (focused on the system, not on who typed what), each postmortem turns one incident's pain into a concrete change that lowers the next incident's MTTR. That's the compounding loop: measure the segments, attack the dominant one, verify the fix, learn in the retro, repeat. MTTR stops being a number you report and becomes a number you steer.
The biggest lever on MTTR is diagnosis, and the biggest lever on diagnosis is reproduction. BugMojo captures the failing session in one click (rrweb replay, console, and network) and hands it to your AI agent over MCP, so engineers skip 'can't reproduce' and go straight to the fix.
Install the free extensionFrequently asked questions
Frequently asked questions
Sources
- DORA's four key metrics including time to restore service, with elite (under 1 hour) to low (1 week to 1 month) performance tiers, DORA (Google) (2025)
- The history of DORA's delivery metrics, including the 2023 refinement of 'time to restore / MTTR' into failed deployment recovery time to isolate change-induced failures, DORA (Google) (2026)
- An explainer of the four DORA keys and how mean time to recover fits alongside deployment frequency, lead time, and change failure rate, Dynatrace (2026)
- A complete guide to measuring DevOps performance with DORA metrics, including how to calculate time to restore, DX (2026)
Get bug-tracking insights, weekly.
Engineering deep-dives, QA playbooks, and honest tool comparisons. No spam. Unsubscribe in one click.