

How to Read a JavaScript Stack Trace (Find the Real Error Fast)
A stack trace looks like noise until you know which line matters. Here's how V8 builds one, how to skip past library frames to your own code, and how source maps turn minified gibberish back into the truth.
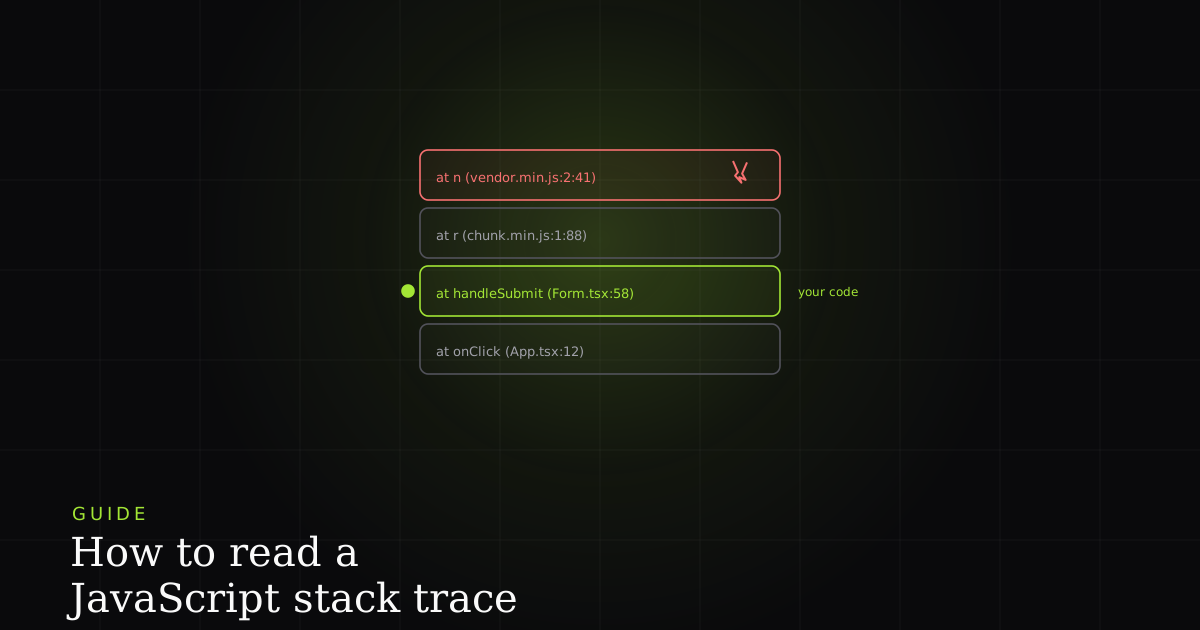
A stack trace is the most information-dense thing your browser hands you when something breaks, and most developers skim past it to the error message and start guessing. That's backwards. The trace tells you exactly which function called which function, in order, down to the throw site. Once you know how to read it, "where is the bug" stops being a search and starts being a lookup.
The anatomy of a stack trace
A JavaScript stack trace is the ordered list of function calls active at the moment an error was thrown, captured as the stack property on the Error object. In V8 (Chrome, Node.js, Edge), it's formatted as a flat string the first time you access it, not a structured object, listing each frame's function name and its file:line:column, from the throw site at the top down to where execution began.
Every trace has two parts. The first line is the error message: the error's type (TypeError, ReferenceError) plus its description. Everything under it is a list of frames, and each frame is a snapshot of one function call that was on the call stack when the error fired. A single frame carries four pieces of information: the function name, and a file, line, and column (the exact character position where that function was executing). The top frame is where the error was actually thrown; each frame below it is the function that called the frame above, so the list reads like a receipt of how execution arrived at the crash.
One caveat worth internalizing early: the stack property is non-standard, and per MDN each engine uses its own format, though they are consistent in high-level structure. Chrome and Safari expose it as a data property on each Error instance; Firefox installs it as an accessor on Error.prototype and omits the leading error-message line, listing frames as functionName@file:line:column. The committee is working to standardize it, but today you can rely on the trace existing and on its shape, not on byte-for-byte identical text across engines.
TypeError: Cannot read properties of undefined (reading 'total')
    at calculateTotal (Cart.tsx:42:18)
    at CheckoutButton.onClick (Checkout.tsx:58:22)
    at HTMLButtonElement.callCallback (react-dom.development.js:4164:14)
    at Object.invokeGuardedCallbackDev (react-dom.development.js:4213:16)
    at invokeGuardedCallback (react-dom.development.js:4277:31)
Reading it top to bottom
Take the trace above. Line one is the error message. Line two, calculateTotal (Cart.tsx:42:18), is the throw site: the exact function, file, line, and column where the error occurred. Line three tells you calculateTotal was called from CheckoutButton.onClick, at Checkout.tsx:58. The remaining lines are React's internal machinery that ultimately triggered the click handler, useful for context, not for finding your bug.
The rule of thumb: scan from the top for the first frame in your own source. Here that's immediately the second line, Cart.tsx:42. That's where to start reading code. In a deeper trace through several layers of library code, you might scroll past five or six frames of framework internals before hitting your own file; that first hit is still the one to trust.
A real trace, walked to the root cause
Reading a trace in the abstract is easy; the payoff is doing it against real code. Suppose Cart.tsx:42 looks like this, and the trace above fired the moment a user clicked Checkout:
// line 38
export function calculateTotal(cart) {
  const items = cart.lineItems;      // line 40
  let total = 0;                     // line 41
  for (const item of items) {        // line 42 — throw site
    total += item.price * item.qty;
  }
  return total;
}
The message says Cannot read properties of undefined (reading 'total'), and the top frame points at line 42. Walking it: line 42 iterates items, which is cart.lineItems. If cart.lineItems is undefined, the for...of throws exactly here. The frame below (Checkout.tsx:58) tells you who passed the bad cart. So the trace hands you both halves of the story: the throw site (line 42, a missing lineItems) and the caller to inspect next (line 58, where cart was built). The fix isn't at the throw site at all. It's making sure Checkout.tsx never hands calculateTotal a cart without lineItems. That is the whole discipline: the top frame tells you where, the next own-code frame down tells you who, and together they point at the real defect.
When the trace is a lie: minified production code
In production, your bundle is minified: variable names shortened, whitespace stripped, often thousands of characters per line to reduce transfer size. The stack trace is still technically accurate, but it now looks like this:
TypeError: Cannot read properties of undefined (reading 't')
    at n (vendor.min.js:2:41118)
    at r (vendor.min.js:2:39982)
    at o (main.min.js:1:8842)
That's not a different bug. It's the same bug from the earlier example, with every helpful name and line number destroyed by the build process. This is where source maps come in. Per web.dev, a source map is a file (its name ending in .map) that most build tools (Vite, webpack, Rollup, Parcel, esbuild) generate alongside the minified output, recording for every position in the compressed code the corresponding position in your original source. Browser DevTools and error-tracking tools consume this automatically, silently turning vendor.min.js:2:41118 back into Cart.tsx:42:18 in the trace you actually read. In Node.js, source-map support isn't on by default. You enable it with the --enable-source-maps flag, which makes a best effort to report stack traces relative to the original source file. Without source maps enabled and deployed correctly, you're stuck debugging by line-number archaeology.
DevTools features that skip the noise for you
Reading traces by eye is a skill worth having, but Chrome DevTools automates most of the frame-skipping. The key feature is the ignore list. Per the Chrome DevTools docs, source maps can carry an ignoreList field (originally x_google_ignoreList, supported since Chrome 106) that names which sources are third-party: framework or bundler-generated code. DevTools hides those frames from the Call Stack, the Sources tree, and the debugger's stepping behaviour, so you see only your own code. Frameworks like Angular and Nuxt already configure this in their source maps: from Angular v14.1.0, node_modules and webpack internals are marked to ignore, so upgrading is often all it takes. You can also right-click any frame and choose to ignore-list that script manually, then toggle "Show ignore-listed frames" in the Call Stack pane when you do want the full picture.
Two more Call Stack tools earn their keep. Restart frame (right-click a frame and select it) re-runs that function from the top without replaying everything before it, so you can step through the suspect function again after inspecting state; per the DevTools reference it works on any frame except WebAssembly, async, and generator functions. And async stack traces stitch the two halves of an async operation together when the framework supports it: DevTools exposes an console.createTask() API ("async stack tagging") that libraries use to link a scheduled callback back to the code that scheduled it.
Node vs. browser: same engine, different edges
Chrome, Edge, and Node.js all run V8, so the trace format and the underlying APIs are the same. The differences are in the tooling and defaults around them, which matters when you're moving between a server crash log and a browser console.
| Feature | Browser (Chrome DevTools) | Node.js |
|---|---|---|
| Default frames kept (Error.stackTraceLimit) | 10 | 10 |
| Source maps applied to traces | Automatic when the .map is available | Opt-in via --enable-source-maps |
| Ignore-list framework frames | ✓ | No built-in UI; filter manually |
| Restart frame in a live debugger | ✓ | Via --inspect + DevTools |
| Error.captureStackTrace / prepareStackTrace | ✓ | ✓ |
| Where you usually read the trace | Console + Sources panel | stderr / log files |
Controlling your own stack traces
If you write custom Error subclasses, V8 gives you Error.captureStackTrace(targetObject, constructorOpt) to control exactly where the trace starts. It adds a stack property to the target object holding the trace as of the moment it was called, and the optional second argument excludes everything above that function, so the trace begins at the real caller instead of inside your own error-construction helper. This is what keeps custom errors as readable as built-in ones.
class ValidationError extends Error {
  constructor(message, field) {
    super(message);
    this.field = field;
    // Exclude this constructor from the trace — start at the real caller.
    Error.captureStackTrace(this, ValidationError);
  }
}
Async stack traces: why they fragment
Stack traces get noticeably less useful once await and .then() enter the picture, and it's worth understanding why so you don't waste time hunting for context that genuinely isn't there. A synchronous call stack is a single, continuous chain: function A called function B called function C, and the trace records every link. An async operation breaks that chain: when a promise resolves later, the code that runs next is scheduled fresh on the microtask queue, with no direct call relationship to whatever originally created the promise. Node's docs put the boundary precisely: a stack trace extends only to the beginning of synchronous code execution, or to the number of frames set by Error.stackTraceLimit, whichever is smaller.
V8 and DevTools do their best to stitch a readable trace back together across await boundaries in modern versions, but it's a reconstruction, not the ground truth: fire-and-forget promises, setTimeout callbacks, and event-based code all still tend to produce a trace that starts fresh at the async boundary, discarding everything that happened before. The practical result: the deeper an error happens inside a chain of async operations, the less the raw trace tells you about how execution actually got there. This is exactly the class of bug where a stack trace alone runs out of usefulness and you need the surrounding context (the sequence of user actions and network calls that led to the async chain) to understand what happened.
A cheap habit that helps: name your functions instead of leaving them anonymous. fetchUserProfile in a trace tells you something useful even when the rest of the chain is truncated; <anonymous> tells you nothing. The same applies to arrow functions: const handleSubmit = async () => {...} shows up as handleSubmit, while an anonymous arrow passed inline as a prop shows up as <anonymous>. It costs nothing at the call site and pays off every time async has already fragmented the trace for you.
Honest caveats: truncation and inlining
A stack trace is a lossy artifact, and two forms of loss trip people up. The first is truncation. Per the V8 docs, almost all errors carry only the topmost 10 stack frames by default. If your bug is 15 layers deep, the frame that actually explains it may have been dropped. The fix is Error.stackTraceLimit: set it higher (say 50), or to Infinity to keep everything, or to 0 to turn capture off for hot paths. Two gotchas: the change only affects traces captured after you set it, and the setting is per V8 context, so it must be set explicitly in each realm (worker, iframe) that needs a different value.
The second is inlining. V8's optimizing compiler can inline a small function into its caller for speed, and an inlined function may not appear as its own frame, so a trace can silently skip a function that really did run. This is a normal performance optimization, not a bug, but it means the absence of a frame is not proof a function wasn't involved. Combined with async gaps and the 10-frame cap, the takeaway is the same: treat the trace as a strong lead, not an exhaustive record.
When the trace still isn't enough
A stack trace tells you where the code broke; it doesn't tell you what data made it break. Reading Cart.tsx:42 is step one. You still need to know what was in response.items or which button the user actually clicked before that line ran. That's the gap a session replay closes: pairing the stack trace with the console log, network requests, and DOM state at the exact moment of the throw turns "here's the line" into "here's the line, and here's exactly why." BugMojo's browser extension captures precisely that pairing (an rrweb DOM replay alongside the console and network activity), so the trace arrives with the UI state that produced it.
Install the free BugMojo extension and capture the exact session (replay, console, and network) alongside the stack trace, so you know what broke and why in one report.
Install the free extensionFrequently asked questions
Frequently asked questions
Sources
- Stack trace API: V8's official docs on Error.stack formatting, Error.captureStackTrace, Error.prepareStackTrace, and the stackTraceLimit default of 10 frames, V8 (Google) (2026)
- Error.prototype.stack (MDN reference): non-standard but universally supported property holding the formatted call stack, with per-engine layout differences, MDN Web Docs (2026)
- Error.captureStackTrace(): MDN reference for the V8 method that attaches a stack trace to a given error object, MDN Web Docs (2026)
- Errors (Node.js API docs): Error.captureStackTrace, Error.stackTraceLimit (default 10), and how async traces extend only to the synchronous boundary, Node.js (2026)
- Command-line API: Node.js docs on the --enable-source-maps flag for source-mapped stack traces, Node.js (2026)
- The ignoreList source map extension: Chrome DevTools docs on hiding third-party framework and bundler frames from stack traces, Chrome for Developers (2026)
- JavaScript debugging reference: Chrome DevTools docs on the Call Stack pane, ignore-listing frames, Restart frame, and async stack traces, Chrome for Developers (2026)
- What are source maps? (web.dev guide to how source maps map compiled code back to original source for production debugging), web.dev (Google) (2026)
Get bug-tracking insights, weekly.
Engineering deep-dives, QA playbooks, and honest tool comparisons. No spam. Unsubscribe in one click.