

console.log Debugging: 12 Techniques Beyond console.log()
console.log() works until it doesn't: a wall of unlabeled dumps, no count of how many times a line ran, no way to pause and inspect live state. Here are the console methods, DevTools breakpoints, and Node tools that scan faster and catch more.
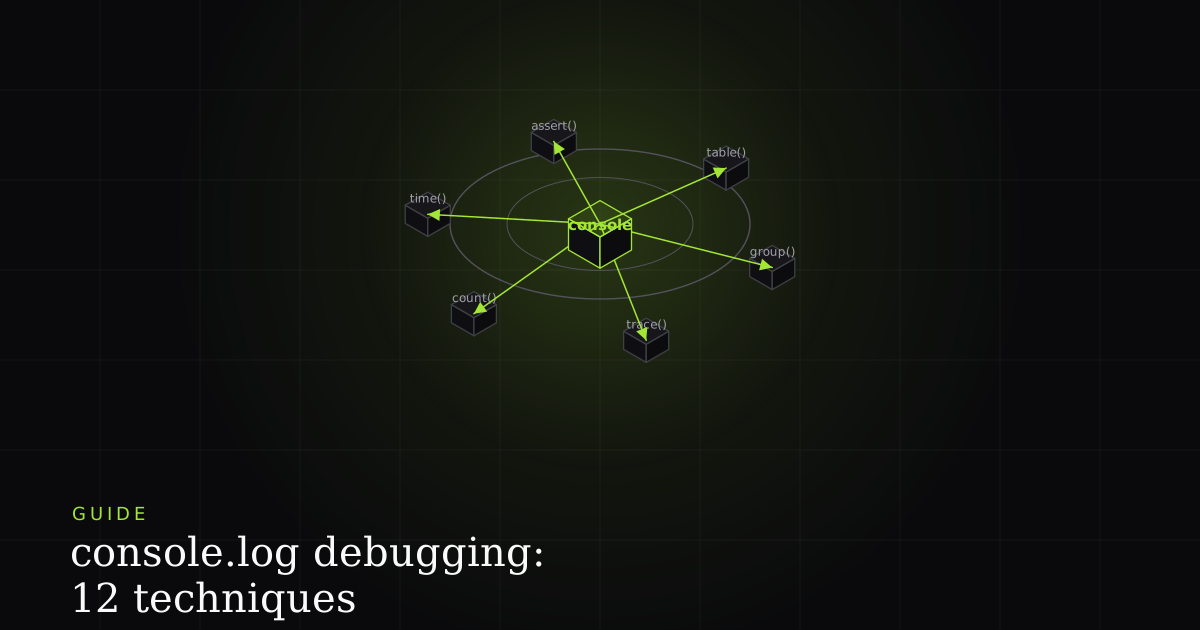
console.log() is most developers' first debugging tool and, for a lot of bugs, their last. That's a shame, because the Console API that ships in every browser (documented on MDN and standardized by the WHATWG Console Standard) has more than a dozen methods built specifically for the situations plain logging handles badly: counting how many times a line runs, timing a slow operation, pausing execution to inspect live scope, or telling at a glance which of ten near-identical objects you're looking at. And beyond the console entirely, DevTools breakpoints and the Node inspector answer questions a log physically cannot. None of this requires a library or a build step. This is a working reference, grouped by what problem each tool solves.
Structuring output so it doesn't scroll past you
The Console API standardized by WHATWG and implemented across Chrome, Firefox, Safari, and Edge includes methods for tabular data (console.table()), nested grouping (console.group()), counting (console.count()), timing (console.time()), and conditional logging (console.assert()), all beyond the single console.log() most developers default to.
The first failure mode of console.log() is visual: dump ten objects in a loop and you get ten collapsed triangles you have to click open one at a time, in a console that's already scrolled past the useful part. Three methods fix this directly.
1. console.table() renders an array of objects (or a single object) as an actual table, one row per item and one column per property. Pass a second array argument and, per MDN, the table includes only the columns whose property names you list, so you can compare values across rows instead of expanding them individually.
const users = [
  { id: 1, name: 'Asha', role: 'admin', active: true },
  { id: 2, name: 'Ben', role: 'editor', active: false },
  { id: 3, name: 'Chen', role: 'viewer', active: true },
];

console.table(users);
// ┌─────────┬────┬────────┬──────────┬────────┐
// │ (index) │ id │  name  │   role   │ active │
// ├─────────┼────┼────────┼──────────┼────────┤
// │    0    │ 1  │ 'Asha' │ 'admin'  │  true  │
// │    1    │ 2  │ 'Ben'  │ 'editor' │ false  │
// │    2    │ 3  │ 'Chen' │ 'viewer' │  true  │
// └─────────┴────┴────────┴──────────┴────────┘

// Second argument filters to specific columns
console.table(users, ['name', 'active']);
2. console.group() / console.groupEnd() / console.groupCollapsed() visually nest related logs under a collapsible header. Per MDN, everything logged after console.group() is indented an extra level until console.groupEnd(), so a multi-step flow (validating an order, then checking payment, then confirming shipping) reads as one indented block instead of nine flat lines you have to mentally reassemble. 3. The %c format specifier applies CSS to a log message, which is enough to make one critical line jump out of a busy console instead of blending into the scroll.
function processOrder(order) {
  console.group(`%cOrder #${order.id}`, 'color:#a3e635;font-weight:bold');
  console.log('Validating items:', order.items.length);

  console.group('Payment');
  console.log('Method:', order.payment.method);
  console.log('Status:', order.payment.status);
  console.groupEnd();

  console.log('Shipping address confirmed');
  console.groupEnd();
}

processOrder(order);
// ▼ Order #4821                 (bold, lime text)
//     Validating items: 3
//   ▼ Payment
//       Method: card
//       Status: authorized
//     Shipping address confirmed

// A standalone styled warning, unrelated to any group:
console.log('%cPayment gateway timeout', 'color:red;font-size:16px;font-weight:bold');

// Use groupCollapsed() instead of group() when logging inside a loop —
// each iteration starts folded so 50 iterations don't push everything
// else off screen.
Counting and timing without doing the math yourself
4. console.count(label) counts how many times a line executes under a given label and prints the running total. It's a one-line way to catch a component re-rendering three times when you expected one, or a handler firing twice because it got attached to the same element in two places. Call console.countReset(label) to zero it out between test runs. 5. console.time(label) / console.timeEnd(label) measure elapsed wall-clock time between two points without you writing const start = Date.now() and subtracting it back out later. And console.timeLog(label) prints an intermediate reading without stopping the clock, useful inside a multi-step job.
function renderWidget() {
  console.count('renderWidget');
  // ...render logic
}

renderWidget(); // renderWidget: 1
renderWidget(); // renderWidget: 2
renderWidget(); // renderWidget: 3  <- unexpected third render, worth investigating

console.countReset('renderWidget'); // next call logs renderWidget: 1 again

console.time('fetchAndParse');
const data = await fetchAndParse(url);
console.timeEnd('fetchAndParse');
// fetchAndParse: 842.35ms

// timeLog prints a checkpoint without stopping the timer
console.time('batchJob');
processChunk(1);
console.timeLog('batchJob'); // batchJob: 210.1ms
processChunk(2);
console.timeEnd('batchJob');  // batchJob: 430.6ms
Assertions and tracing: catching what you didn't expect
6. console.assert(condition, message) is the inverse of a normal log: it only prints when condition is false. That means you can scatter invariant checks through your code (a price should never be negative, a required argument should never be undefined) and leave them there permanently. They're silent when everything's fine and loud the moment an assumption breaks, which is a better trade than either deleting the check or littering the console with "OK" messages. 7. console.trace() prints a full call stack at any arbitrary point in your code, not just when something throws. Per MDN, some browsers also show the asynchronous sequence of calls leading to the trace. That's the direct answer to "who is calling this function, and from where" when a value changes but you can't tell which of five call sites did it.
function applyDiscount(price, code) {
  console.assert(price > 0, 'applyDiscount called with a non-positive price', price);
  console.assert(typeof code === 'string', 'discount code should be a string', code);
  // ...discount logic
}

applyDiscount(49.99, 'SAVE10'); // silent -- both assertions pass
applyDiscount(-5, 'SAVE10');
// Assertion failed: applyDiscount called with a non-positive price -5

function getCurrentUser() {
  console.trace('getCurrentUser called from:');
  return currentUser;
}

getCurrentUser();
// console.trace: getCurrentUser called from:
//   at getCurrentUser (app.js:42:11)
//   at renderHeader (app.js:18:20)
//   at initApp (app.js:6:3)
8. The debugger; statement is the most powerful item so far precisely because it isn't a console method at all. It's a JavaScript statement that, with DevTools open, pauses execution at that exact line. A log gives you one snapshot of one value at one moment; a breakpoint gives you the entire live scope. You can inspect every local variable, walk the full call stack, step forward one line at a time, and even edit a value in the console and resume execution with the new value in place. Drop it inside a loop or a conditional branch that only sometimes misbehaves, and you get to watch the misbehavior happen instead of guessing at it after the fact.
function calculateTotal(cart) {
  let total = 0;
  for (const item of cart.items) {
    debugger; // execution pauses here on every iteration, DevTools open
    total += item.price * item.quantity;
  }
  return total;
}

// With DevTools attached, this pause lets you:
// - inspect `item`, `total`, and `cart` live, not as a frozen log snapshot
// - see the full call stack that led here
// - step line by line with the debugger's step-over / step-into controls
// - type a new value into the console and resume with it applied
Smarter object and array inspection
9. console.dir() fixes a specific and common annoyance: console.log(domElement) renders the element as HTML markup, which is useless if what you actually want is its JavaScript-side properties. console.dir(domElement) instead prints a fully expandable JS object view (style, dataset, classList, event listeners), the same way it would show any other object. 10. The %o and %O format specifiers let you force that same object formatting inline inside a message string, when you want the label and the object view together instead of a separate console.dir() call. 11. Passing a labeled object (console.log({ user, response }) instead of console.log(user, response)) is a small habit that fixes a real problem: wrapping values in an object literal makes DevTools show the variable's name next to its value, so you never have to guess which unlabeled blob was which three scrolls later.
const button = document.querySelector('#submit');

console.log(button); // renders as an HTML element / markup tree
console.dir(button);  // renders as an expandable JS object: .style, .dataset, ...

// %o forces object-style formatting inline
console.log('Clicked element: %o', button);

// %O (capital) keeps the full, non-cyclic inspection view
console.log('Full context: %O', { event, target: button });

// Labeled objects: DevTools shows the property NAME next to the value
const user = { id: 12, plan: 'pro' };
const response = { status: 200, latencyMs: 118 };

console.log({ user, response });
// { user: { id: 12, plan: 'pro' }, response: { status: 200, latencyMs: 118 } }
// vs. console.log(user, response), which prints two unlabeled blobs
Why logpoints and breakpoints beat console.log
Every technique above still means editing a file, saving, and re-running, and then remembering to strip it back out. The Sources panel in Chrome and Edge DevTools removes that whole loop. 12. Logpoints (log-line-of-code breakpoints) are the drop-in replacement for a scattered console.log: right-click a line number and choose "Add logpoint", then type an expression. Per Chrome's breakpoints guide, a logpoint logs messages to the Console without pausing execution and without cluttering your code with console.log() calls. Because it lives in DevTools, not your source, there is nothing to accidentally commit, and it survives a page refresh in a way an unsaved inline log doesn't.
Conditional breakpoints solve the loop-that-fires-hundreds-of-times problem. Right-click a line number, choose "Add conditional breakpoint", and enter an expression like item.price < 0; execution pauses only on the iteration where that's true, instead of you clicking "resume" 200 times to reach the one bad record. Watch expressions, added in the Watch pane, evaluate any valid JavaScript expression continuously as you step, so you can keep an eye on cart.total or user.permissions.length without re-typing it into the console at each pause. And when execution is paused, the Call Stack pane lets you click up the stack, inspect variables in each frame's Scope, and even edit their values in place.
The Network panel: logs the console can't give you
A surprising number of "the data is wrong" bugs aren't JavaScript bugs at all. They're a request that returned a 500, a payload that shipped the wrong field name, or a CORS preflight that never completed. No amount of console.log inside your handler will show you that, because the problem happened on the wire before your code ran. The Network panel logs every request the page makes, one row per resource, with its status code, timing waterfall, request and response headers, and the full response body. When a value is missing on screen, checking the actual response there (before you touch the rendering code) is often a two-minute fix instead of an afternoon of logging your way down the call chain.
Debugging Node.js beyond console.log
On the server, console.log hits a wall fast: log a deep object and Node prints [Object] or [Array] past a certain depth, because console.log quietly calls util.inspect(), which, per the Node docs, defaults to a depth of 2. Call util.inspect() yourself with { depth: null } to recurse all the way down, plus colors: true for readable terminal output. Better still, skip printing entirely: node --inspect starts the V8 Inspector (default port 9229) so you can attach full Chrome DevTools (breakpoints, watch, call stack) to a server process via chrome://inspect. Use --inspect-brk to break on the first line so nothing runs before you attach.
import { inspect } from 'node:util';

const payload = { user: { profile: { settings: { theme: { mode: 'dark' } } } } };

console.log(payload);
// { user: { profile: { settings: [Object] } } }   <- truncated at depth 2

console.log(inspect(payload, { depth: null, colors: true }));
// full nested object, all the way down, colorized

// Or drop console.log entirely and attach a real debugger:
//   $ node --inspect-brk server.js
//   Debugger listening on ws://127.0.0.1:9229/...
// then open chrome://inspect, click "inspect", and set breakpoints in DevTools.
// A `debugger;` statement in your code will pause there just like in the browser.
console.log vs logpoint vs breakpoint vs session replay
Each tool trades convenience for depth, and depth for reach. A raw console.log is fast to type but blind to anyone else's session; a breakpoint sees everything but only while you're paused at the keyboard. Here's how the four map onto the questions you actually ask while debugging.
| Feature | console.log | Logpoint | Breakpoint | Session replay |
|---|---|---|---|---|
| No source edit / redeploy | No | ✓ | ✓ | ✓ |
| Pause and inspect live scope | No | No | ✓ | No |
| Fire only on a condition | manual if | ✓ | ✓ | captures all |
| Survives a page refresh | if in source | ✓ | ✓ | ✓ |
| Shows console + network together | No | No | partly | ✓ |
| Works on a session you weren't in | No | No | No | ✓ |
Caveats: console.log in production is a liability
These techniques are for development. Shipping them is a different question. Left-in logs create console noise (the one message you need buried under hundreds you don't), and they cost performance: serializing a large object on a hot path is real work, and holding a reference to it in a log can keep it from being garbage-collected. web.dev's guidance on debugging performance in the field leans on structured tools like PerformanceObserver rather than ad-hoc logging precisely because production needs signal, not spew. The sharper risk is data leakage: console.log(response) can dump auth tokens, PII, or a full API body into a place users, browser extensions, and support screenshots can all read. Strip debug logs from production builds, and if you must log in the field, log narrow, redacted values, never whole objects.
Install the free BugMojo extension so every bug report arrives with the full console log, network requests, and a DOM replay attached. No more asking a user to open DevTools for you.
Install the free extensionFrequently asked questions
Frequently asked questions
Sources
- console: Web API reference covering table(), group(), trace(), count(), time(), assert() and the full Console API surface, MDN Web Docs (2026)
- console.table() static method: MDN reference, including the optional columns argument that filters which properties are shown, MDN Web Docs (2026)
- console.trace() static method: MDN reference (outputs a stack trace, and in some browsers the async sequence of calls leading to it), MDN Web Docs (2026)
- Pause your code with breakpoints: Chrome DevTools guide to conditional breakpoints, logpoints, watch expressions and the call stack, Chrome for Developers (2026)
- Inspect network activity: Chrome DevTools reference for the Network panel (request rows, headers, response bodies and timing), Chrome for Developers (2026)
- util.inspect(object, options): Node.js API reference (default depth of 2, colors, showHidden and defaultOptions), Node.js (2026)
- Debugger: Node.js guide to node inspect, --inspect / --inspect-brk (port 9229), the debugger keyword and chrome://inspect, Node.js (2026)
- Debug performance in the field: web.dev on using PerformanceObserver and console logging to diagnose real-user issues, web.dev (2026)
- Console Standard: the WHATWG living standard defining the full Console API surface implemented across browsers, WHATWG (2026)
- Console object API reference: Microsoft Edge DevTools documentation covering the same cross-browser console methods, Microsoft Edge Developer Docs (2026)
Get bug-tracking insights, weekly.
Engineering deep-dives, QA playbooks, and honest tool comparisons. No spam. Unsubscribe in one click.